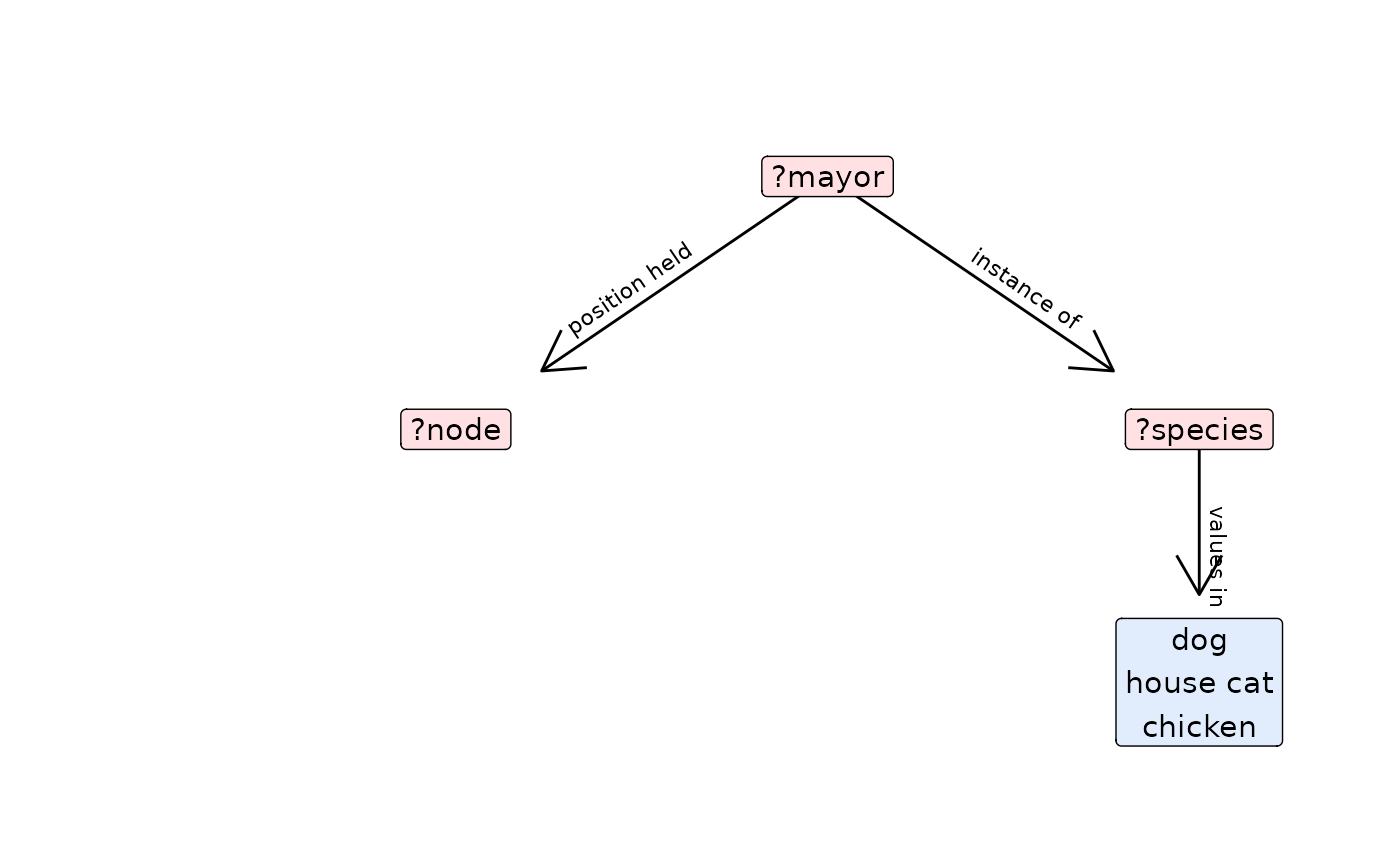
Plot query step as a graph.
Usage
plot_query_step(graph, plotstep, layout = "tree", flip = FALSE, legend = FALSE)
Arguments
- graph
a tidygraph object
- plotstep
the step to plot
- layout
type of layout. Can be e.g. "fr" or "tree". Defaults to "tree"
- flip
whether to flip the coordinates. Defaults to FALSE
- legend
whether to draw a legend. Defaults to FALSE
Value
a plot of the graph depicting query setp
Examples
query=spq_init() %>%
  spq_add("?mayor wdt:P31 ?species") %>%
  spq_set(species = c('wd:Q144','wd:Q146', 'wd:Q780')) %>%
  spq_add("?mayor p:P39 ?node") %>%
  spq_add("?node ps:P39 wd:Q30185") %>%
  spq_add("?node pq:P642 ?place")

gq=graph_query(query,labelling=TRUE)
plot_query_step(gq$graph,plotstep=3)

